Report builder and dashboards
The Problem
Vault customers need to generate data fast. They must manage and report on various custom and standard objects within their account, including documents, workflows, users, and object records frequently. Ad hoc reports take too much time to set-up, waste time to repetitively build, and joining multiple data sets outside the system using third-party tools or pivot tables is too technically demanding for some users.
The Solution
A configurable report builder enables customers to build powerful reports to answer commonly asked questions, organize, analyze, and share data related to your documents and processes. Reports can be structured to run a tabular or matrix report, saved for reuse, shared with other parties or kept private, and scheduled to run and notify select recipients at set intervals.
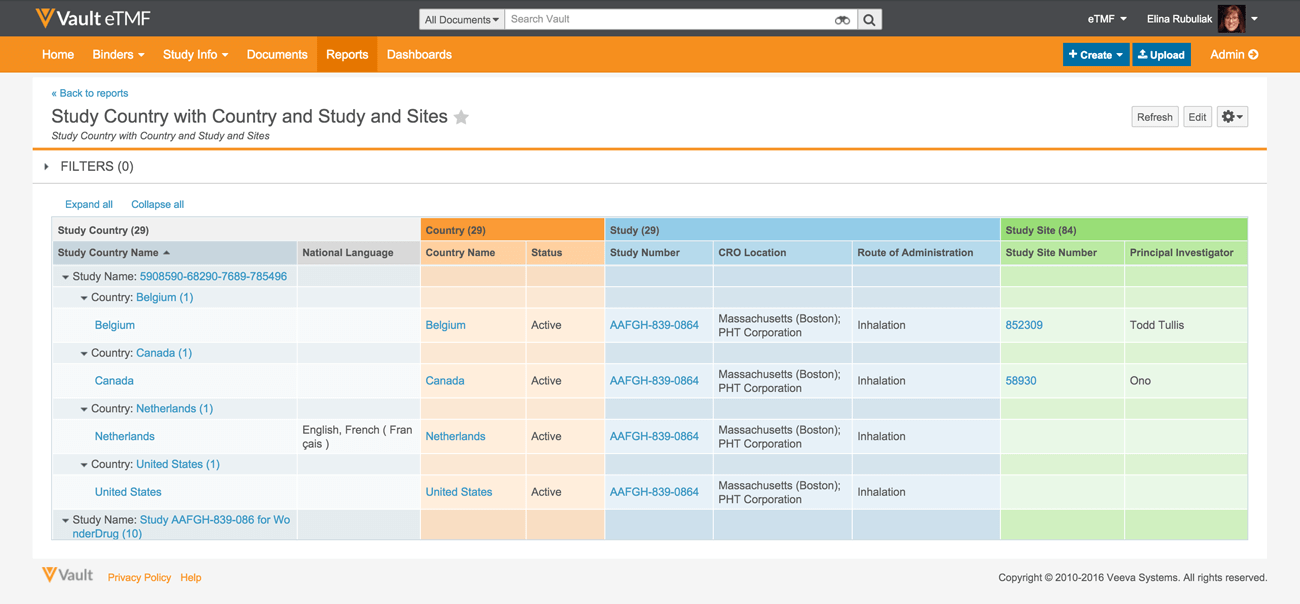
Reporting can be performed on documents, workflows, and object records or a combination of multiple objects. When creating new reports, a user can filter, sort and group results as needed to render only needed information. Prompts can be added as dynamic filtering to be entered at run-time. All reports can be shared with other users, quickly duplicated and exported to as a text, CSV, or Excel file.
On run-time, document and object types are automatically grouped in sections with columns color to avoid column label ambiguity.
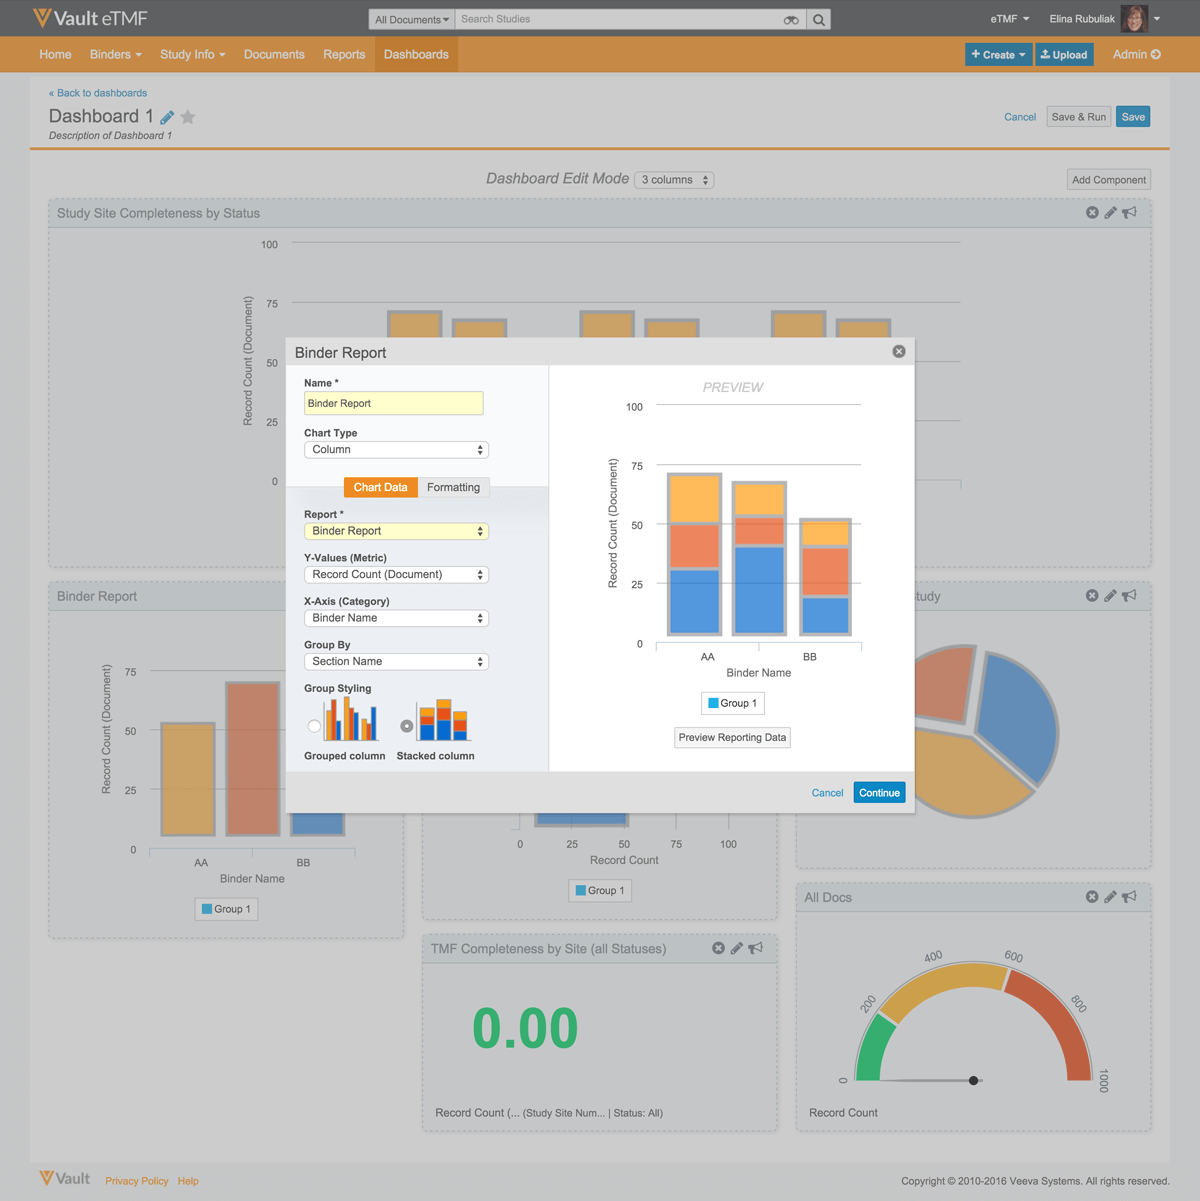
Reports can be charted directly into custom Vault dashboards. Dashboards provide an at-a-glance understanding of key metrics. Each dashboard contains one or more dashboard components and each component displays metrics from a report.

Available chart types include column, bar, gauge, numerical count, and pie charts. Labels and grouping can be applied per chart component. If reports used to build the dashboard include filters and prompts, those filters are also applied to the dashboard.


